


spindle GitHub

spindle

A lock-free shared-memory IPC bus, and a study of where queue latency actually goes.

Header-only C++20. Single- and multi-producer ring buffers over /dev/shm, benchmarked coordinated-omission-free on a weakly ordered Arm server core against rigtorp, moodycamel, boost, and a mutex baseline.

120 nsone-way p50
235 nsping-pong RTT p50
4.7×vs mutex baseline
0drops, 5 × 1 M samples

Read the paper (PDF) Browse the source

Results — the comparison window paper §5.6 · bench/results/…-queue-*-r100000.json

Five queues, one window, one queue swapped at a time

Same machine, same harness, same measurement window: a single serial pass with every queue behind the same registry and adapter contract. Ping-pong RTT is taken on the producer's PMU cycle counter (0.34 ns resolution); one-way latency on the shared generic timer (40 ns quantisation). Five repetitions of one million samples per cell, offered at 100 kHz, zero drops anywhere.

Ping-pong round-trip percentiles, aarch64 Neoverse-N1, 2026-08-28. Lower is better.
QueueRTT p50RTT p99 RTT p99.9One-way p50
spindle::spsc_ring235 ns249 ns269 ns120 ns
rigtorp::SPSCQueue235 ns247 ns322 ns120 ns
boost::lockfree::spsc_queue272 ns285 ns355 ns120 ns
moodycamel::ReaderWriterQueue317 ns325 ns439 ns160 ns
spindle::spsc_naive (mutex baseline)826 ns1.34 µs3.68 µs560 ns

Where the samples actually fell ping-pong RTT · 5 M samples per queue · log scale

Ink density is sample density. The axis runs 100 ns to 5 µs, which covers every queue from its fastest sample through p99.9; the chevron at the right edge marks the fraction beyond it, and the full ladder including each maximum is one click below.

Full percentile ladder, including the deep tail
Queuep50p90 p99p99.9p99.99max
spindle::spsc_ring235 ns240 ns249 ns269 ns13.1 µs120 µs
rigtorp::SPSCQueue235 ns240 ns247 ns322 ns14.9 µs231 µs
boost::lockfree::spsc_queue272 ns279 ns285 ns355 ns13.1 µs182 µs
moodycamel::ReaderWriterQueue317 ns322 ns325 ns439 ns16.3 µs213 µs
spindle::spsc_naive826 ns1.07 µs1.34 µs3.68 µs29.8 µs194 µs

Beyond p99.9 this shared-tenancy VM is environment-dominated: every queue, including the mutex baseline, sinks into the same floor, because what is being measured there is the hypervisor and the co-tenants rather than the queue. Quantified in the paper's threats to validity.

spindle's ring ties rigtorp::SPSCQueue at p50 and p99 — the expected result for a shared design lineage, reported as a tie rather than framed as a win — and posts the tightest p99.9 of this window. folly::ProducerConsumerQueue was skipped and the skip is documented: its header is not standalone, and hand-porting it would benchmark a folly that folly never shipped. Fairness deviations between adapters are recorded in ADR-0011; this is one measurement window on one machine, and the caveat travels with the number.

Stipple engraving of a bridge arch dissolving into fog, printed in vermillion on cream.
Plate II — stipple engraving tone is dot density: the same idea the charts on this page use

Method — measure the ruler first paper §3, §5.1 · bench/results/co-demo-*-2026-08-27.json

Two traps sit between you and an honest latency number

On this Neoverse-N1 the architectural counter (cntvct_el0) runs at 25 MHz — a 40 ns tick, coarser than the operation being measured. Two sysctls later, the PMU cycle counter reads from userspace at about 0.34 ns per tick. That is the easy half.

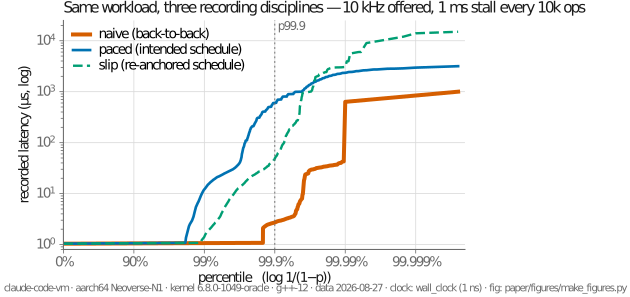
The harder half is coordinated omission. Time each operation back-to-back and every stall politely pauses your own load generator, so the histogram never sees the queue at its worst. spindle measures against an intended schedule at a fixed offered rate instead. Same workload, same machine, two recording disciplines:

Naive timing versus an intended schedule identical workload · 200 k samples each · log scale

paced — measured against the intended schedule naive — timed back-to-back Both recordings pile at 1.08 µs. Only one of them shows the millisecond stalls that were there the whole time.

Percentiles, both recordings
Recordingp50p90 p99p99.9p99.99max
paced — intended schedule1.08 µs1.08 µs12.1 µs605 µs2.35 ms3.17 ms
naive — back-to-back1.08 µs1.08 µs1.08 µs2.72 µs632 µs1 ms

Synthetic operation: a 1 µs spin with a 1 ms stall every 10,000 operations, offered at 10 kHz (bench/co_demo.cpp). Naive timing reports p99.9 of 2.72 µs; the paced truth is 605 µs. The size of that understatement is itself run-dependent — 38× on one committed run, 222× on this one — which is the point: the naive number is not merely wrong, it is unstably wrong. Both runs are committed.

Figure 1 from the paper: percentile curves and histograms for the coordinated-omission demo — naive, paced, and slip-corrected.
Fig. 1 from the paper. Generated by paper/figures/make_figures.py from the committed raw JSON. No figure in this project is drawn by hand, and each one carries the machine block of the file behind it.

Architecture — the shared-memory transport ADR-0006, ADR-0007 · include/spindle/shm_ring.hpp

Two processes, one segment, zero locks on the data path

The header is release-published and validated field by field on attach. Geometry is recomputed per process, so no pointer ever enters the segment. Every contended index sits alone on its own padded cache line, and each side keeps a private cached copy of the other's index — the fast path generates no coherence traffic at all. Hover any row for the reason it exists.

The spindle shared-memory transport A producer process and a consumer process attach to one shared-memory segment containing a 448-byte header (magic word, epoch, creator identity, two heartbeats and a futex doorbell), two padded index cache lines for tail and head, and a power-of-two array of slots. Messages move from the producer through the slots to the consumer. /dev/shm/spindle-<name> 448 B header — validated field by field on attach The magic word is the LAST thing create() publishes, as a release store. An attacher acquire-loads it: seeing magic guarantees every other header field is visible. The same publish idiom as the ring itself. magic + ABI version — release-stored last A stale segment whose creator died is unlinked and re-created with epoch+1, so a process still holding the old mapping can detect that it is orphaned. epoch — bumped on every re-create PID reuse is defeated by pairing the creator PID with its /proc start time. Heartbeats are the cheap runtime signal; this pair is the arbiter of liveness. creator pid + start-time — liveness arbiter Each side stamps a cntvct tick onto its own cache line — a relaxed store to a self-owned line, so keeping the heartbeat costs no coherence traffic. heartbeat A · heartbeat B — cntvct ticks The consumer parks here via FUTEX_WAIT; a push into an armed doorbell, and close(), wake it. Cost: the producer pays one seq_cst doorbell load per push — measured and reported at 3.32 microseconds p50, not hidden. futex doorbell — 32-bit, 4-byte aligned index lines — alignas(64), each alone on its own cache line tail — the 64-bit monotonic write index, alone on its padded cache line. PadBytes is a template parameter, and the padding sweep of Claim 1 varies exactly this, from 0 to 256 bytes. tail pad → 64 B head — the 64-bit monotonic read index on its own padded line. Indices never wrap: slot = index & (capacity − 1), and full-versus-empty falls out of tail − head. head pad → 64 B slots[] — power-of-two capacity · raw storage + placement new Only trivially copyable types cross the boundary — elements move by memcpy, and geometry (capacity, mask, offsets) is recomputed on attach, never trusted from the segment. The producer keeps a PRIVATE copy of head and only re-reads the shared line when the ring looks full — so the fast path generates no coherence traffic at all. producer process core 2 · SCHED_FIFO 50 cached_head (private) The consumer mirrors it: a private cached_tail, refreshed with one load-acquire only when the ring looks empty. How it waits is a policy — spin, backoff, futex park, or the adaptive budget of Claim 3. consumer process core 3 · SCHED_FIFO 50 cached_tail (private) one-way p50 across the process boundary: 120 ns — identical to the in-process ring spin consumer; the futex doorbell trades that for 3.32 µs and a sleeping core crash safety: the release store of tail IS the commit point

Crossing the process boundary costs nothing the coherence protocol was not already charging. The cache line is the unit of truth, and it does not care about your address space.

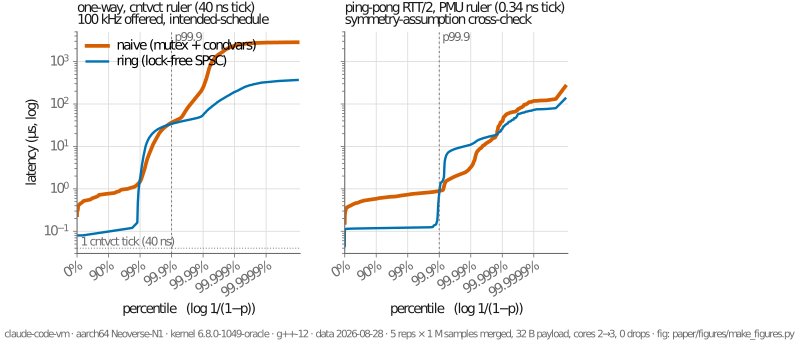
Figure 2 from the paper: latency distributions of the mutex baseline versus the lock-free ring, one-way and round-trip, on Neoverse-N1.
Fig. 2 from the paper. Mutex-plus-condvar baseline against the lock-free ring: one-way p50 560 → 120 ns, ping-pong RTT p50 892 → 232 ns. Above p99.9 this shared-tenancy VM is environment-dominated and both queues sink into the same floor — stated in the paper's threats to validity, not footnoted away.
Stipple engraving of a city skyline with a tapering tower, printed in vermillion on cream.
Plate III — stipple engraving every claim below was registered before it was measured

Claims — registered before measurement paper §5.3–§5.5 · docs/adr/

One confirmed, one inverted, one negative

Three claims, each with its experiment, its committed results and its failure modes. The predictions went into the ADRs before the measurements ran — including the ones that could come back null, and the one that came back against the hypothesis. All three are reported as they landed.

Claim 1 · padding

64 bytes is enough — on this core

Intel's adjacent-cache-line prefetcher drags 128-byte pairs, so hardware_destructive_interference_size (64 on both ISAs) is contested in practice: folly and the JVM pad 128 on x86 while GCC, the kernel and rigtorp use 64. spsc_ring<T, PadBytes> makes the padding a template parameter and sweeps 0–256 B.

Sub-64-byte layouts pay real false sharing — 3.9 consumer L1D misses per message against a 2.02 floor, and +40 ns at the median. But there is no 64→128 cliff on Neoverse-N1: 64/128/256 B measure 2.02/2.03/2.02 misses per message. The registered no-adjacent-line-prefetcher prediction, confirmed.

Claim 2 · memory ordering

The x86 folklore inverts on Arm

"Acquire/release is free" is a statement about x86 instruction mappings, not about hardware. The same ring is built four ways, the hot loops are disassembled from the running binary into bench/results/asm/, and a deliberately broken all-relaxed variant runs as the falsification control.

seq_cst and acq_rel are indistinguishable (RTT p50 236.6 vs 237.0 ns — g++-12 lowers both to ldar/stlr with zero dmb). Relaxed-plus-standalone-fences is 30% slower. The broken control both corrupts — 112 stale reads and 2 torn payloads per 2.5 M messages — and stalls, with one observed maximum of 36.5 s.

Claim 3 · adaptive waiting

Adaptive spinning never beats busy-spin

The consumer estimates inter-arrival gaps online (an EWMA plus a P² streaming quantile estimator) and buys spin time under an explicit CPU budget — Karlin's competitive spinning with a duty-cycle constraint, ancestry cited rather than claimed as novel.

It never beats busy-spin on latency, and is published as such; nothing can. What it wins is the frontier: on bursty arrivals it holds busy-spin's 120 ns median at roughly 50% measured duty, and it is the only sub-full-duty policy that stays on the latency-per-CPU frontier in all three arrival regimes without retuning.

Every measured number on this page is aarch64/Neoverse-N1. The x86-64 half of the cross-ISA study is not yet measured: the paper publishes it as registered, falsifiable predictions stated before that machine runs, and the figure pipeline extends itself the moment correctly named x86 result files land.

The source MIT · header-only · no dependencies

Written to be read, not only to be run

Every non-obvious construct carries a // C++ NOTE: block explaining why it is written that way, and the design notes in docs/cpp-primer/ pick those blocks up by grep-able anchor. Where a naive implementation exists next to an optimised one, both are kept — the measured delta between them is the point.

// C++ NOTE: why not std::this_thread::yield() in a spin loop.
//   yield() is a SYSCALL asking the scheduler to run someone
//   else. On a pinned, otherwise idle core there is no one
//   else: you pay a kernel round trip (~µs) per iteration and
//   learn nothing. The right tool is a CPU *hint* instruction
//   that stays in userspace and merely de-aggresses the
//   pipeline for a few ns. On x86 that is `pause`. On aarch64
//   the architectural hint is `yield` (the instruction, not
//   the syscall) — but it exists for SMT siblings, and
//   Neoverse-N1 has no SMT, so `yield` retires as a NOP and
//   the loop hammers the load unit at full rate. […]
asm volatile("isb sy" ::: "memory");  // measured, not folklore

From include/spindle/spsc_ring.hpp, abridged. The measurement behind the comment: on this core the isb hint costs about 13 ns and actually de-aggresses the loop, while yield costs nothing and does nothing.

Stipple engraving of a city rising against a mountain ridge, printed in vermillion on warm cream.
Plate I — stipple engraving everything below runs from a clean checkout

Reproduce scripts/run_official_session.sh · one serial pass

Every number traces to a file you can open

No result on this page is a mean. Each is a full distribution from an HdrHistogram-style recorder, and each lives in a committed JSON that carries the exact command that produced it and the state of the machine at that moment.

1 · build and calibrate the ruler

$ ./scripts/setup_perf.sh
# userspace PMU access — two sysctls, reset on reboot
$ cmake --preset release && cmake --build --preset release
$ ctest --preset release
100% tests passed, 12 of 12
# asan, ubsan and tsan presets exist and run in CI

2 · the measurement session

$ sudo ./scripts/run_official_session.sh
# one serial pass, no concurrent builds:
#   padding sweep → orderings → adaptive → shm → queues
# SCHED_FIFO 50, cores 2 and 3, RT throttling off
#   (leaving the throttle on was a 40 ms p99 artifact —
#    found, fixed, and documented rather than dropped)

and every result file carries its machine — excerpt, verbatim keys

"machine": {
  "hostname": "ampere-a1",   "arch": "aarch64",   "core_count": 4,
  "cpu_model": "Neoverse-N1", "kernel": "6.8.0-1049-oracle",
  "compiler": "g++-12 12.3.0", "transparent_hugepages": "madvise",
  "aslr_randomize_va_space": 2, "perf_event_paranoid": 1,
  "perf_user_access": 1,     "sched_rt_runtime_us": -1,
  "loadavg": [5.32, 6.23, 4.62], …
}

That load average is real. The reference machine is a shared-tenancy 4-core cloud VM, and the results record it rather than hiding it: p50 and p99 are trustworthy here, deep tails at and beyond p99.9 are environment-dominated and should be read that way. If a setup detail can flip a conclusion, it belongs in the file with the number.